Broadening the Scope of Diagnostics
Yokogawa explains how to go beyond the usual diagnostics in control systems: let us see what physical phenomena affect the control elements and process units, and how to highlight malfunctions in order to intervene
Control systems have always been rich in diagnostic functions regarding electronics, both their own and the measurement instruments’. However, it is necessary to think bigger, and to provide information about physical phenomena which may occur in control elements or process units. With Yokogawa InsightSuite, heat exchanger diagnostics consists of monitoring some KPIs updated every half hour or every hour, calculated on the basis of the data available in the DCS (moving average over 10 minutes, diagnostic scan cycle 30 or 60 minutes). In particular, the following conditions are evaluated: Fouling Index, relative to the difference between the current heat exchange coefficient and the one in the condition just after cleaning; Heat Balance Index, represented by the heat exchanged between the two fluids; Thermal Efficiency Index, defined on the basis of the differences between the temperatures of the two fluids at the inlet and outlet of the exchanger.

How to evaluate heat exchangers based on KPI trends
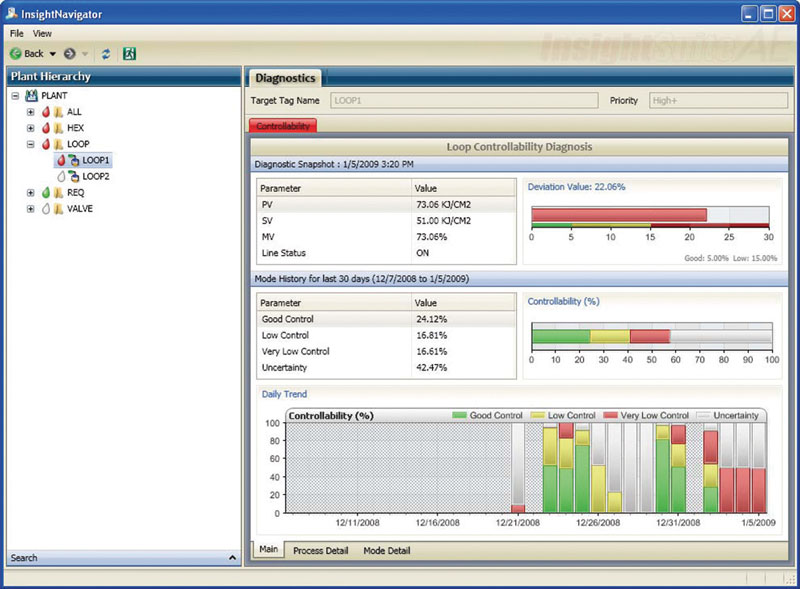
The package requires real-time process data (such as, Shell Inlet Temperature Tag/Unit), exchanger design data (for instance, LMTD) and operational information (such as the cleaning interval). As process data, the four temperatures and two fluid inlet and outlet flow rates are required; four pressures are only required to evaluate losses in the Fouling Index calculation. Of course the typical profile of these variables is different depending on whether the exchanger is a counter-current or an equiverse current type. On the basis of the KPI trend, the package provides a dashboard to identify the exchangers which are performing badly, the trend of the performance indexes, and a probable date by which some of them may fall below a programmable threshold, in order to give the user a reference for the next maintenance intervention. Thanks to intuitive red, yellow and green bar graphs,
the operator can easily identify the so-called “bad-actors” and the days when something went wrong; in figure 1, an example of these dashboards, related to the monitoring of the adjustment rings.
Some examples of diagnostics of valve behaviour
In process plants, valves are critical elements and can be subject to numerous “ailments” leading to performance degradation. The position required by the control system (through the positioner) may be reached with a good accuracy by continuously evaluating the setpoint value and the position return: if the deviation is higher than a programmable threshold, it is reported to the operator for appropriate checks. Sometimes, perhaps due to excessive aggressiveness of the positioner, it moves cyclically around the position value desired by the control system, without really stabilising. This behaviour can also be detected by monitoring the oscillations compared to those occurring under normal conditions. On the other hand, poor air supply may be detected by monitoring the air pressure and comparing it with the desired value. There may also be mechanical connection problems, such that the valve does not move as quickly as expected; in this case the speed at which the position return follows the request of the control system must be evaluated. Friction and rubbing may, on the other hand, cause the valve to behave non-linearly, affecting the entire control loop. The solution lies in calculating the standard deviation of the distribution of the difference between the required and actual position. Other malfunctions may be related to packaging or wear, but it is possible to detect anomalies by monitoring the valve stroke times to change position. Even for valves, a practical dashboard allows to identify visually those having serious, slight or negligible problems thanks to the red, yellow or green bars respectively.

Cavitation in pumps
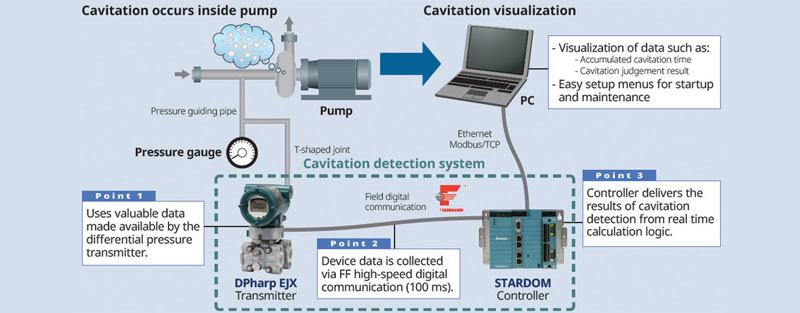
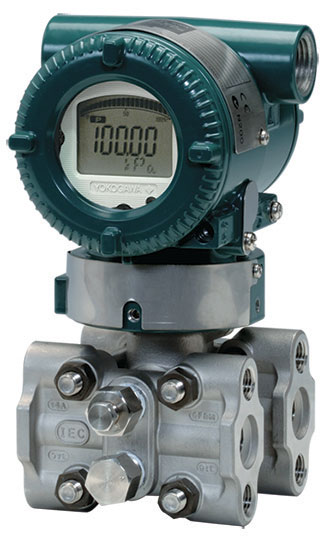
Cavitation is a physical phenomenon whereby the difference in pressure inside a flowing liquid can rapidly cause the formation of vapour-filled cavities, or “bubbles”. The energy released when the bubbles collapse may create significant damage to the equipment and consequently also a system failure. Cavitation not only reduces the size of the pump or the pumping cross-section of the pipeline, but also inflicts permanent damage to its components. Detecting signs of such wear at an early stage is difficult. In many cases the phenomenon is discovered too late, when employees detect acoustic or vibrational anomalies. In addition, other components connected to the pump (such as the motor driving it, local monitoring equipment and upstream or downstream piping) have already been affected. Conversely, even slight variations in the differential pressure on the suction side of the pump may be detected by a high-precision pressure transmitter (accuracy of up to 0.025% of the span, and response time of 90 ms), which is part of the IIoT system (in Figure 2). The pressure sensor transmits these data to the associated evaluation system in real time, so that conclusions may be drawn about the onset or existence of cavitation.

A real-time control system
To detect cavitation in real time, a data acquisition cycle of 100 ms is required, as well as a control system with high-speed, real-time calculation functionality. The control system analyses the internal, unfiltered pressure values produced by the differential pressure transmitter in order to obtain information on pressure profiles both in the pump and in the connected pipes. The raw data are converted into robust information with the help of special routines in the control system before being transmitted to maintenance personnel. Each Yokogawa Stardom controller is equipped with an integrated web server which can be pointed at by any device supporting a web-browser. This information, together with the overall running time of the pump, may thus be displayed via the Internet or Intranet, as well as transmitted to a PC via the Modbus protocol.

