Improve Production with Data Analysis
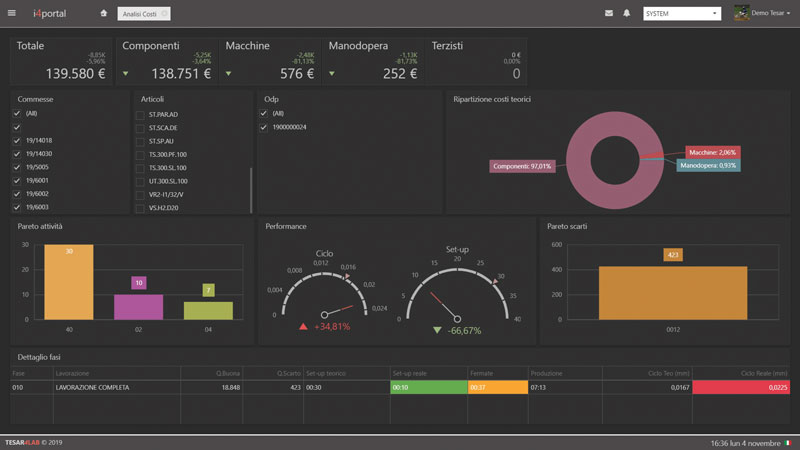
Tesar proposes its Analytics tool that allows companies to collect production data, and to show them graphically with graphs and grids. Then information can be integrated with data from sales or management
Over time, data evolved and from simple technical factor it has become a strategic element for mainly companies. It is essential to collect Big Data and use them effectively in the decision-making process, obtaining concrete resources and benefits. For this reason, in the new data driven manufacturing companies, data collection systems are an essential element. The analysis and management of production through the declarations of the operators and above all the machines connected according to the Industry 4.0 paradigm, are able to generate thousands of data in an increasingly shorter period of time, which must then be managed. Tesar offers I4Dashobard, an Analytics tool that is a dynamic and multi-source reporting, able to show datas graphically in an intuitive and dynamic way.
Creating graphs and grids from one or more databases
I4Dashobard allows a complete view of the various dashboards and supporting multi-user management on a single portal. The application lets you to create graphs and grids from one or more databases: these are collected primarily by the production system, but then can be integrated with data from sales or management. The reports are then ‘navigable’: from the annual data you can access the monthly ones, and get even more specifically to the individual sales order, checking the number and status of orders in production. Data source filtering is in great demand because it centralizes all corporate reporting with a single tool, allowing you to manage multilevel reports dedicated
to multiple functions.

Benefits range from production to relations with suppliers
The advantages of a detection and analysis system are evident: better control of production and greater precision in the evaluation of interventions. The system operates in real time, allowing operators to check the production trend at any time on the specific machine and on the individual production order. This detection capability allows you to adjust the definition of the production cycle in order to also make better planning. The benefits are also reflected in maintenance, thanks to the analysis of telemetry, peaks in energy consumption and downtime. Each event falls, in fact, into a specific type of stop, identified by the declaration made by the operator or by the machine. The analysis on the dashboard is thus useful in order to focus production improvement efforts. Moreover, the benefits also have repercussions beyond the factory walls. Precisely knowing the timing of each phase of the process and the presence of any bottlenecks is also crucial in relations with suppliers and customers to monitor on-time delivering. From a lean 4.0 perspective, the analysis represents a driving force for the entire Supply Chain, ensuring that just in time logic is applied.

